
Documentation / Costs, invoices and reports
Annual summary, cost per vehicle and comparisons
These reports sit in IntelliFleet > Reports next to Costs: the Annual summary under Reports, and Cost per vehicle (TCO), Branch and fleet comparison and Invoice allocation under New in IntelliFleet. They need the Costs permission. As everywhere, you see only vehicles in the branches you have access to.
Every amount is a cost: the net amount plus the VAT that cannot be deducted, worked out the same way as on the Costs list. VAT counts as cost when the expense is not marked as deductible, and half of it when the vehicle's VAT status is 50 %.
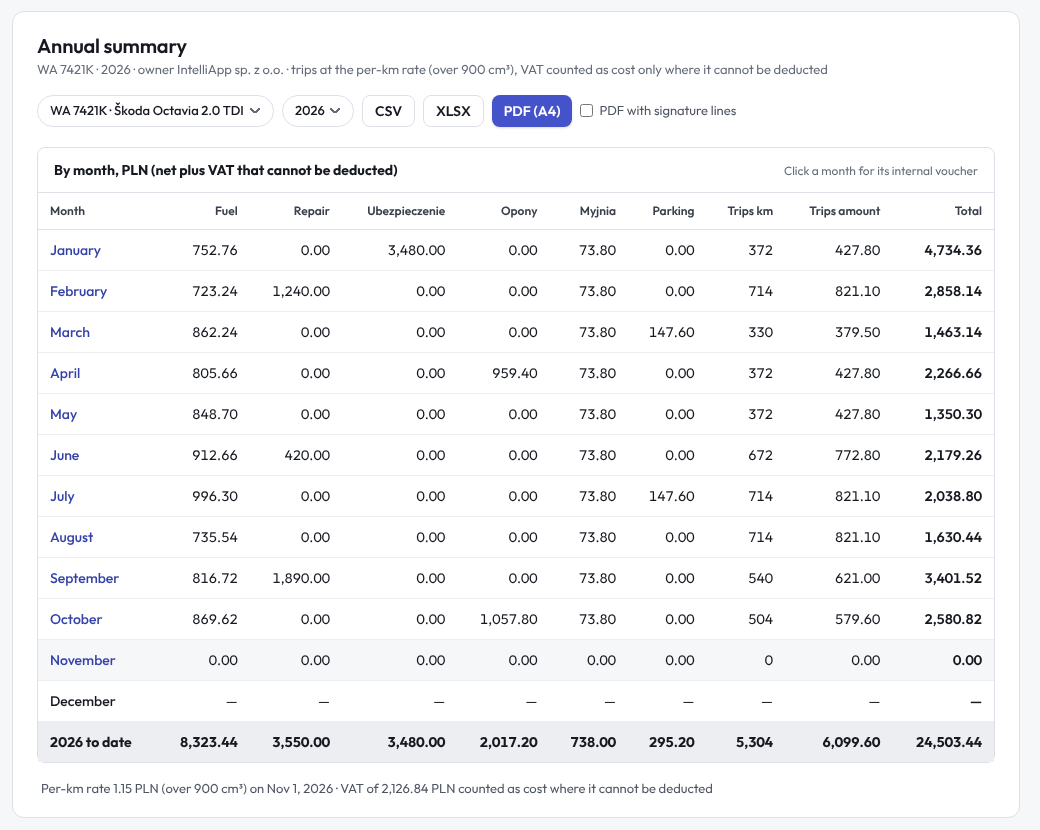
Annual summary
The annual summary is the yearly statement of one vehicle's operating costs and trips that Menedżer Pojazdów users know as "Zestawienie roczne". Pick the vehicle and the year.
- One row per month; the months still to come show a dash.
- One column per cost category: Fuel (fuel entries and expenses marked as a fuel purchase), Repair, Tyres, and each expense type by its name. With more than six categories, the smallest are added up as Other.
- Trips km and Trips amount: the month's business trips and what they are worth at the per-km rate. The rate is the statutory one in force on the trip date for the vehicle's type and engine capacity (up to or over 900 cm³), set on the trip when it is saved; imported trips keep the old app's amount. Private trips do not count.
- Total: the costs plus the trips amount.
- The bottom row adds up the year so far. Under the table you see the per-km rate that applies to the vehicle now and how much VAT was counted as cost.
Click a month to print its internal voucher. The voucher's amount is the month's Trips amount.
Export the summary as CSV, XLSX or PDF (A4).
Cost per vehicle (TCO)
One row per vehicle for the period: Fuel, Service and repairs, Tyres, Other expenses (and Work, from the column list), Financing, the Total, the Km driven (from odometer readings) and the Cost per km. Click a registration number to open the vehicle.
Financing counts the monthly instalment of each lease, rental or loan agreement of the vehicle for every month the agreement runs in the period, up to today. When an expense of that month already names the agreement's contract number (in its item or document number), that month's instalment is not counted again: the invoice is the instalment. Instalments count at their net amount.
The tiles show the total cost (with the non-deductible VAT in it), financing, the average cost per vehicle and the cost per km, each compared with the period before.
Branch and fleet comparison
One row per branch, or per fleet with By fleet: the number of vehicles, the costs, financing, the total, the kilometres and the cost per km and per vehicle. By branch, a cost counts in the branch the vehicle belonged to on the cost date, as on the Costs list, and a vehicle's kilometres count in the branch it belongs to at the end of the period. Vehicles without a fleet make one row of their own.
Invoice allocation
The purchase invoices issued in the period:
- By invoice: each invoice with its net amount, how much of it is allocated, what is left, the vehicles it went to and what became of an AI suggestion (AI accepted, AI corrected: rejected and allocated differently, AI waiting or AI rejected). Pick Not yet allocated only instead of All invoices to keep the invoices still to do.
- By vehicle: each confirmed allocation to a vehicle; group by vehicle to see the total per vehicle.
The tiles show what is not yet allocated, what is allocated to vehicles, and how many AI suggestions were accepted or corrected. If you see only some branches, you see only the invoices allocated to their vehicles.
Common to all
Pick the period with This month, Last month, This year, Last year or Custom, and narrow it with Branch, Fleet, Vehicle and Currency. Click a column header to sort, Group by a column for subtotals, choose columns with Columns, and export with CSV, XLSX or PDF (A4). Totals and subtotals come from the server and cover every row, not just the page. Save view keeps the filters, grouping, sort and columns of TCO, the comparison and invoice allocation under a name, as in the Costs report; the annual summary has no saved views.